Monitoring of soil and buildings stability and deformations
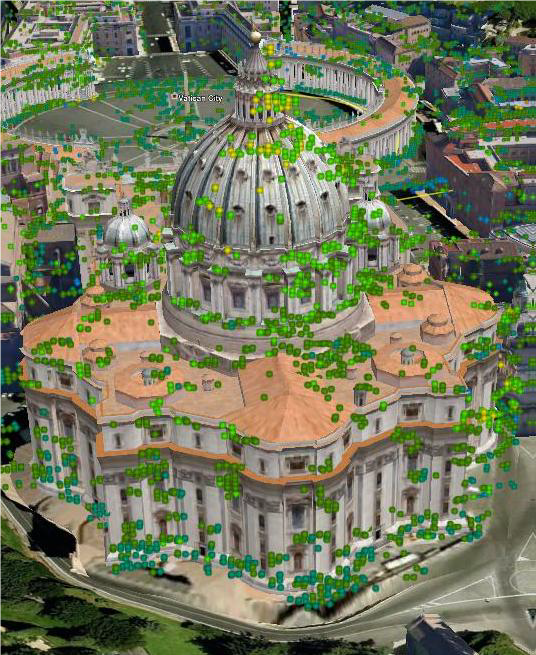
Example of 3D visualization of DIFSAR analysis results (San Peter, Rome)
Soil and buildings stability will be monitored through a consolidated DIFSAR interferometric methodology based on satellite SAR data. This will allow quick and cost-effective monitoring of the area, with a very close detail on single objects of interest.
The service will be performed through the use of different methodologies, in particular InSAR analysis from VHR satellite SAR data, RPAS close survey and IOT sensors on site.
The system will be able to generate and raise to the AWARE platform warnings and alarms.
Anthropic activities (identification of waste and debris)
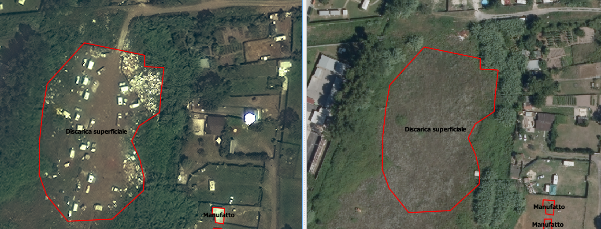
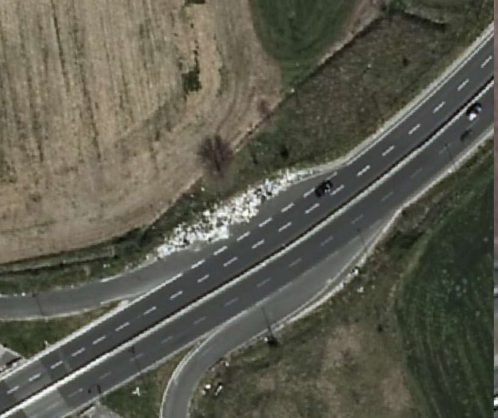
Example of illicit waste depot detection by the use of VHR satellite images
The monitoring of anthropic activities foresees the assessment and temporal evolution of illegal waste depots and debris and possible additional topics.
This service will be performed through the use of regular RPAS surveys, taking images of the path of Tevere river crossing the historical center of the town. The selection of the site is motivated by the potential damages that waste and debriefs thrown away along the banks and in the water may provoke to the structures of the historical bridges during the periodical flowns.
The collected images are then post-processed and checked, via dedicated algorithm against previous dataset for change detection.
The RPAS used for the surveys is equipped with a high-resolution daylight camera and a thermal camera.
Weed vegetation
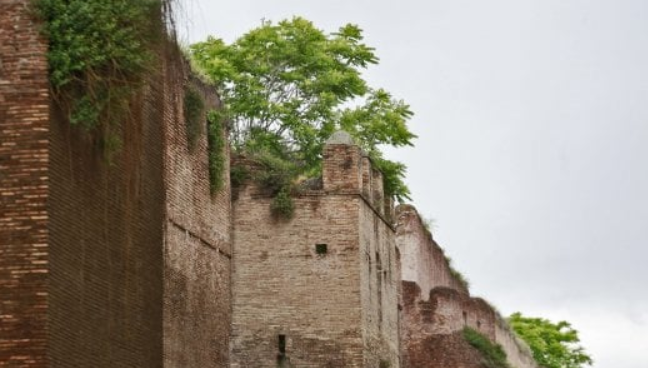
Rome, weed vegetation on Aurelian Walls
The monitoring of weed vegetation affecting the surfaces of historical buildings and archaeological remains is of primary importance to assure their conservation. Damages caused by vegetation growth are, in fact, generally very relevant and may jeopardize the structural assessment of the affected objects.
The presence and grow rate of this vegetation will be monitored through specific surveys by RPAS, equipped with optical video camera and thermal camera. It will be analyzed the vegetation NDVI and the eventual presence of humidity within the observed structures.
This service is performed by RPAS surveys, taking images of the area to be examined. The collected images are then post-processed and checked, via dedicated algorithm against previous dataset for changes detection.
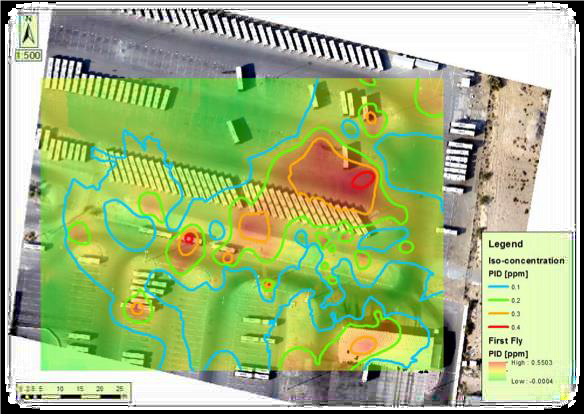
Concentration of pollution sprays in the urban environment
Msp of pollutants distribution
The concentration of pollutants in urban environment is particularly dangerous, not only for human health, but also for the conservation of CH. Two main phenomena will be analyzed: darkening and recession of the exposed surfaces.
Degradation of monuments is related to the concentration of some pollutants as nitrogen dioxide, sulfur dioxide, ozone and particular matter. It is not possible to investigate the local peak of pollutant with actual customer data. The service developed with the Scenario Pollution will be able to generate NRT alert to understand the risk of degradation and darkening of CH.
The Agencies (ARPA and ENEA) that produce air pollutant data over City of Rome realize modelled data to a coarse spatial resolution (1.50:000-100.000) and daily data focused on providing a forecast of pollution. Then these data are not able to describe local variability near the cultural heritage site. This effect is significant because some pollutants, such as particulate matter, vary locally even every 30-100 meters.
By integrating the different data sources (drone, sensors, weather stations), it will be possible to understand the spatial pollution patterns and position the sensors in the field in an appropriate way. Then the service will create layers with a spatial resolution of 1:5.000-10.000 and NRT temporal resolution.